chapter 5 Getting a sense of Big Data and well-being
Are Big Data even actually new?
While data are ‘sold’ to us as ‘the new oil’1, large datasets, and their use to understand human behaviour, are not new; neither is the relationship between governments, commerce and value, when it comes to data. Mary Poovey’s A History of the Modern Fact: Problems of Knowledge in the Sciences of Wealth and Society ((1998)) describes the rise of merchants and their influence over the State, including campaigns to promote the balance of trade as the index of national well-being from the early seventeenth century onwards2. The new ‘enthusiasm for numbers’ in the early to mid-nineteenth century3 coincided with a growing infrastructure to collect and analyse data. This desire for numbers, and the data processes that were required to provide them, led to the ‘great explosion of numbers that made the term statistics’4. If truth be told, the term ‘statistics’ originated for governments to understand ‘the quantum of happiness’5. In this ‘avalanche of numbers’, ‘nation-states classified, counted and tabulated their subjects anew’6. However, while ‘statistics’ may be hundreds of years old, large datasets go back further.
Managing land, agricultural hierarchies and the desire to control populations have long required systems of recording. One of the oldest-known writing systems is Sumerian script, which is approximately 6000 years old7. This script is called cuneiform, and its uses are said to include the tracking of trade and taxes: you need records on who has paid, how much; who has not paid, and what they owe8. While the clay tablets these records were written on may not seem like a database, or feel like the Big Data futures outlined in the previous and subsequent sections, they were a dataset of sorts. Crucially, these data were used to monitor and control resources, including the management of people.
Most countries now undertake a census of sorts. The UK Census takes place every ten years and has done since 1801.7 The first four were only headcounts, with the 1841 Census being the first to intentionally record names of all individuals in a household or institution. The UK’s ONS website offers an interesting history of censuses in the UK, back to the Domesday book ordered by the Norman (French) King, William the Conqueror in 10869. Again, censuses precede these European data moments by some 4000 years in both Egypt and China, whose governments (as they would have been formed and named in those days) recorded who lived where and how wealthy they were. The Romans held regular censuses to keep track of their expanding—and then contracting— empire. Evidence of other institutionalised data practices exists in the Bible: the book of Genesis talks of kinship and marriage records and Exodus mentions a population census to support the tabernacle. The Church collected information on births, christenings, marriages, wills and deaths; this tracked the business of a church and its parish, but was also a means of counting the faithful and tracking their wealth.
You will note that the recording of trade and births, marriages and deaths is not so different from the administrative data that appear in all our examples of well-being data, from Table 3.1 to 5.3. So, what is new about Big Data? We’ve long had large datasets that hold multiple data points on people and nations, but these are thought to be ‘state simplifications’ for officials10. Rationalisation and standardisation mean these representations ‘did not successfully represent the actual activity of the society depicted, nor were they intended to; they represented only the slice of it that interested the official observer’11. What the historian James Scott tells us here is that the sorts of information that were collected on scale lacked detail that could be used to improve quality of life. He implies, of course, that those in charge did not actually care about quality of life, only quantity of resource, whether this was people to work the land, make armies, or pay taxes. More recently, as we have seen, governments were charged with responsibility for people’s well-being, and therefore, more complex data were required.((Although, of course, given what we have seen elsewhere in the book, we might question whether the changing possibilities for what data could describe, changed policy, rather than the other way around.)) One such development was the social survey.
The social survey has been used to collect data which capture various qualities of lives in richer ways, and for longer, than it is often credited for. For example, surveys in the UK in the mid-1940s (in World War II) discovered almost one in ten households did not have the number of cups deemed necessary for essential use, and ‘the shortage of scrubbing brushes seems to have been extensively felt’12. Whilst still administrative records of resource and scarcity, the survey began to be used to articulate more qualitative aspects of quality of life as proxies for well-being. This presents richer detail than many of the contemporary surveys that generate the well-being data we have seen as either objective or subjective data so far.
These more qualitative data were not only collected using government social scientists that we might imagine with clipboards. A project called Mass Observation was established in 1937 by anthropologist Tom Harrisson, poet Charles Madge and filmmaker Humphrey Jennings.(( There were a number of iterations of Mass Observation, with different people initiating them, but these were the original founding members.)) Mass Observation aimed to record everyday life in Britain. There were paid investigators who anonymously recorded people’s conversations and their behaviour: at work, on the street and at memorable occasions, including public meetings or sporting and religious events.
This project was reminiscent of the current idea of ‘Big Data’, not only in the scope of the data gathered, but also in how they were gathered. Mass Observation had numerous phases and at one point also used a panel of around 500 voluntary ‘observers’. The initial aims of Mass Observation were to research everyday life, making use of ‘the untrained observer, the man in the street’((There were no women observing anything in those days, of course.)) as much as those who were thought to be skilled and qualified in gathering data of this sort13. The observers used various data collection methods to generate large datasets on different topics: some maintained diaries, while others replied to open-ended questionnaires. In 1938, there was ‘a competition’ for the residents of Bolton, Lancashire (see Fig 5.2), asking people what happiness meant for them. This was one of many themes, and people would reply to what were called directives with often very long texts describing what they thought and how they felt. The data from these and from the 1938 project can still be accessed via a vast archive at the University of Sussex.((See Mass Observation (n.d.) website for more on the data available and how to access them.))
Mass Observation began with a positive vision of democratising the processes behind how data were gathered to better understand people’s lives. However, over time, much qualitative social research shifted towards the narrower analysis of consumer choice, and Mass Observation became a market-research firm in 194914. Mass Observation relaunched in 1981, returning to its original egalitarian ideals and the archives are testament to the ways that Mass Observation aims to engage the public in the documenting of their own lives.
These historical examples of large datasets are, therefore, not so different from the qualities found in previously crowdsourced, location based, time-based data on how people feel about things, as seen in Table 5.3. The purchasing of scrubbing brushes was used as proxy data for other qualities of life in the same way our purchasing data are analysed to better understand us. Similarly, a lack of cups was indicative of a particular kind of poverty and lack of resources at a point in time, and this was analysed across the population. However, the democratic promise of Mass Observation and other projects of the time were superseded by the potential of understanding what makes people happy for commercial gain.
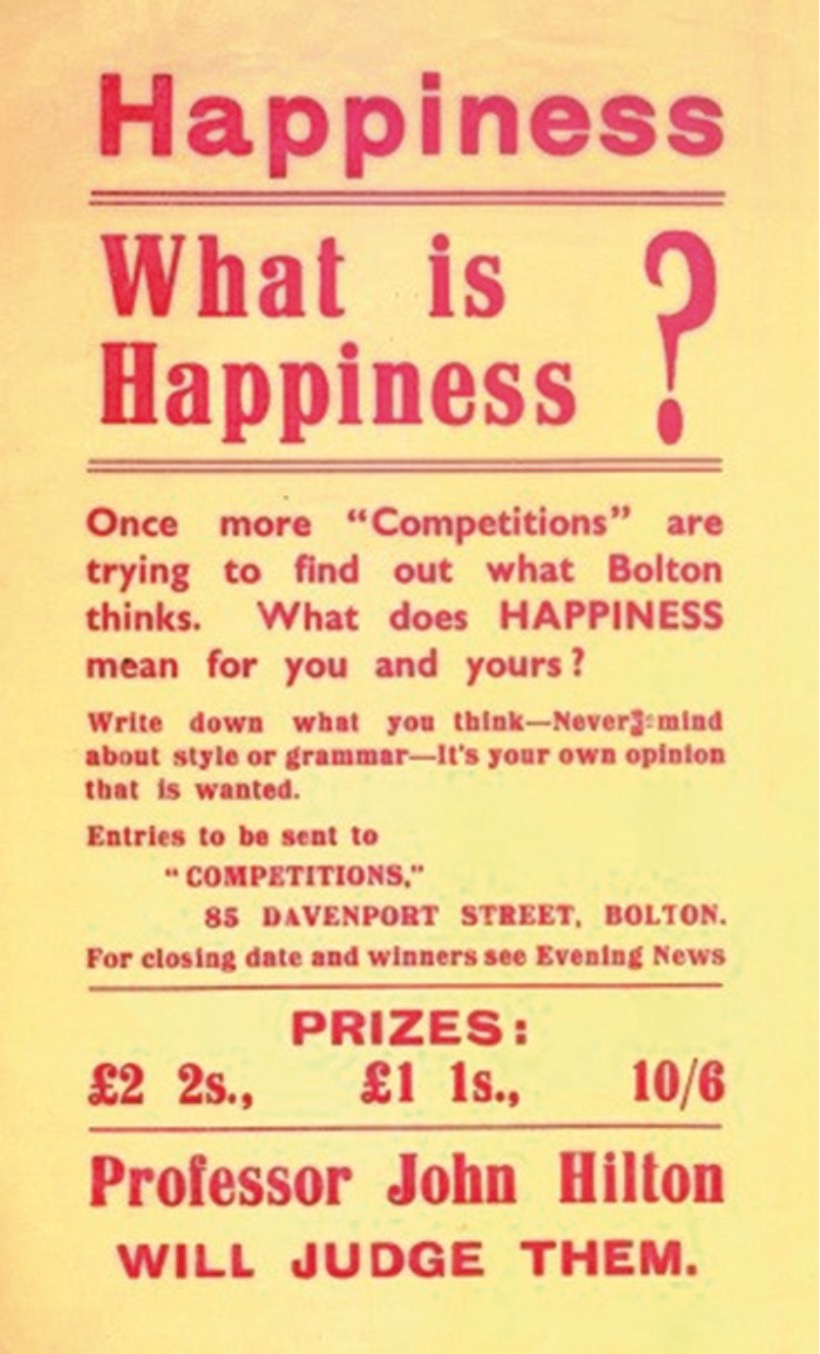
Fig. 5.2 What is happiness? Mass Observation competition flyer, 1938
- The Economist 2017 [↩]
- Poovey 1998, 93–94 [↩]
- Hacking 1991, 186; Porter 1986, 1996 [↩]
- Porter 1986, 11 [↩]
- Sinclair 1798, vol. 20, p. xiii [↩]
- Hacking 1990, 2; 1991, 186 [↩]
- Bellet and Frijters 2019 [↩]
- Harford 2017 [↩]
- ONS 2016 [↩]
- Scott 1998 [↩]
- Scott 1998, 3 [↩]
- Oman 2015, 88; ONS 2001, 9 [↩]
- Madge and Harrisson 1937, 10 [↩]
- Albert 2019 [↩]