chapter 4 Discovering ‘the new science of happiness’ and subjective well-being
Evaluation measures
Life satisfaction is the most commonly used evaluative measure of well-being1. Life satisfaction data are collected using questions similar to question 2 in the ONS4, ‘Overall, how satisfied are you with your life nowadays?’ The measure is popular with economists for policy-relevant research for numerous reasons. First, because of its longstanding prevalence in international and national-level surveys, such as Health Survey England, and more recently, the OECD’s high-profile Better Life Index. Second, it is thought to be accessible to policy-makers2. Third, some believe it to be the idea of subjective well-being that overlaps most successfully with how people make decisions in their own lives3. However, some evidence suggests that, as a concept, life satisfaction is not understood by all members of the general public, particularly those who are marginalised in some way4. We might also question how universal a measure it is in developing contexts, which calls into question its utility on a global scale.
General happiness has been used as an alternative to life satisfaction and features in many international-level surveys. Key happiness variables seem to impact on general happiness responses in a similar way as life satisfaction5. The measure aims to assess a person’s general happiness, and a popular example of trying to collect data on this concept is Cantril’s (1965) ‘ladder of life’((Despite the popularity of the ladder of life, concerns have been raised about the integrity of the research behind it from an ethical and methodological perspective. An interesting history can be found in Zubaida 1967.)) (see Fig. 4.2). The Gallup World Poll uses the principles of Cantril’s ladder, where the questions are asked using a scale. This is a ‘self-anchoring ladder’, which asks respondents to evaluate their current life from 0 (worst possible life) to 10 (best possible life).
The term ‘general happiness’ can be used in reports6 to mean the general happiness of a nation, or indeed, as John Stuart Mill((John Stuart Mill was the son of one of Jeremy Bentham’s proteges. Mill’s own depression at 20 caused him to question Bentham’s assumptions about happiness. He decided there were better versions of happiness that are linked to noble pursuits.)) intended, ‘the sum of individual happinesses’7. This can be confusing and is something to be mindful of. It is not always clear if the term general happiness, when used to refer to population happiness, means taking individual-level data from something like Cantril’s ladder and multiplying it to derive a population-level measure, or if it is another measure, such as life satisfaction, used at scale.
Domain satisfaction is an approach which is interested in how people evaluate different features of their life, such as ‘work-life balance’ or ‘relationships’. These different features of our lives are grouped together into domains, which we have seen as a prominent feature in the objective lists approach. With the UK’s national well-being domains, that would be: personal finance, the economy, what we do, health (Physical and mental), education and skills, our relationships, governance, where we live, the environment. In theory you could collect satisfaction data about each domain, and if a person were satisfied with all domains this could demonstrate overall ‘life satisfaction’.
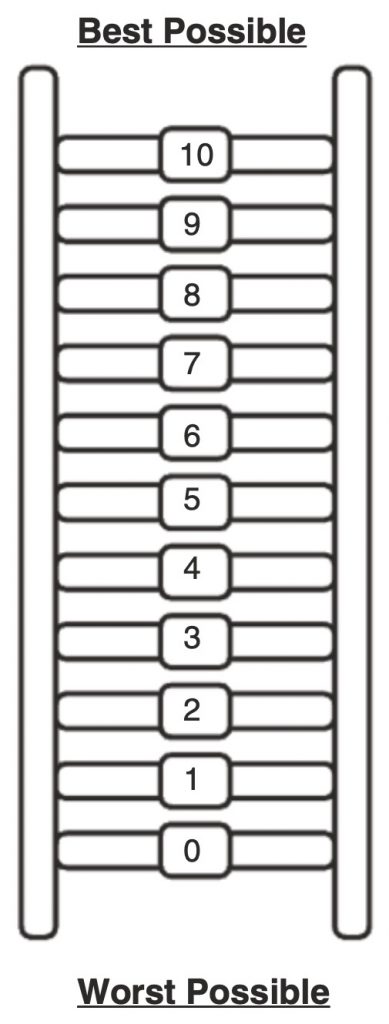
Assume that this ladder is a way of picturing your life. The top of the ladder represents the best possible life for you. The bottom rung of the ladder represents the worst possible life for you.
Indicate where on the ladder you feel you personally stand right now by marking the circle.
Fig. 4.2 Cantril’s ladder. (Adapted from Cantril 1965)
An example of a question to derive domain satisfaction data is from Understanding Society: UK Household Longitudinal Study8, in which respondents are asked to rate their satisfaction with their general health on a scale from ‘completely dissatisfied’ to ‘completely satisfied’. Domain satisfaction data can be used to compare the reality of life with various standards of success9. Various domain satisfaction measures have been shown to correlate with numerous socio-demographic characteristics relative to income, health and gender, for example, and this has been replicated across studies10. Confusingly, sometimes the term ‘domain satisfaction’ is used to describe satisfaction across all domains11 but it more frequently refers to satisfaction within a specific domain, such as ‘satisfaction with personal relationships’, or ‘satisfaction with health’ which both appear in the UK’s national well-being measures. As with the case in this index, domain satisfaction is most often used in an objective list approach with other administrative data. This means not all the domains are measured using satisfaction data, but with proxy data, such as crime rate or education level.
Affect is a term used to describe the experience of feeling or emotion and is prevalent in psychology. As an aside, the term has recently been taken up in the broader social sciences and humanities to describe emotion and experience in a less medicalised way12. While the concept is linked, these theoretical uses of the concept of affect are not really captured by surveys, which is an important distinction that is rarely acknowledged.
General Affect means how people are doing overall and is a concept which is understood in evaluation questions. In psy-sciences,((The psy-sciences are generally considered to be: psychology, psychiatry, psychotherapy and psychoanalysis)) it is the relative frequency of positive and negative affect that is thought to be key to how we experience well-being. The Affect Balance Scale13 and the Positive and Negative Affect Scale, or PANAS14, involve questionnaires that are designed to gain numerical responses to general statements about different affects. These questions are also used in some large-scale surveys, such as the English Longitudinal Study of Ageing15.
Influential psychologists Huppert and Whittington have cautioned for some time that different versions of positive and negative scales are less similar than implied. Also, these scales are susceptible to change and adaptations in surveys. This must be accounted for when considering subjective well-being metrics which use them. Affect is also a key part of experience measures, which want to capture affect at a particular time or context.
This scale consists of a number of words that describe different feelings and emotions. Read each item and then list the number from the scale below next to each word. Indicate to what extent you feel this way right now, that is, at the present moment OR indicate the extent you have felt this way over the past week (circle the instructions you followed when taking this measure)
Fig. 4.3 PANAS questionnaire.16
| 1 Very slightly or not at all | 2 A little | 3 Moderately | 4 Quite a bit | 5 Extremely |
| __________ Interested __________ Distressed __________ Excited __________ Upset __________ Strong __________ Guilty __________ Scared __________ Hostile __________ Enthusiastic __________ Proud | __________ Irritable __________ Alert __________ Ashamed __________ Inspired __________ Nervous __________ Determined __________ Attentive __________ Jittery __________ Active __________ Afraid |
Scoring instructions:
Positive Affect Score: Add the score on items 1, 3, 5, 9, 10, 12, 14, 16, 17, and 19. Scores can range from 10 – 50, with higher scores representing higher levels of positive affect. Mean Scores: Momentary = 29.7 (SD = 7.9); Weekly = 33.3 (SD = 7.2)
Negative Affect Score: Add scores on items 2, 4, 6, 7, 8, 11, 13, 15, 18, and 20. Scores can range from 10 – 50, with lower scores representing lower levels of negative affect. Mean Score: Momentary = 14.8. (SD = 5.4); Weekly = 17.4 (SD = 6.2)
- Fleche et al. 2012 [↩]
- Donovan and Halpern 2002 [↩]
- Kahneman et al. 1999 [↩]
- Oman 2017a; Ralph et al. 2011 [↩]
- Dolan et al. 2011a, b; Waldron 2010 [↩]
- i.e. World Happiness Reports Helliwell et al. 2017, 2019 [↩]
- Mill, cited in Crisp 1997, 78 [↩]
- University of Essex et al. 2020 [↩]
- Veenhoven 1996, 30 [↩]
- Dolan et al. 2008 [↩]
- van Praag et al. 2003 [↩]
- Sedgwick and Frank 2003; Thrift 2004; Massumi 2002; Ahmed 2010; Berlant 2011; Wetherell 2012, etc. [↩]
- Bradburn 1969 [↩]
- Watson et al. 1988; see Fig. 4.3 [↩]
- ELSA n.d. [↩]
- Adapted from Watson et al. 1988 [↩]